
From Data to Decisions: Mastering Labor Market Indicators
Using Python and FRED API to Build a Robust Economic Analysis Toolkit

In this post, we’ll continue exploring labor market indicators that can provide timely insights into the direction of economic trends. As you may notice, this post is accessible in full only to paid subscribers. Moving forward, approximately half of my posts will remain free, while the other half will be exclusive to paying subscribers. This shift also means I’ll be increasing the overall number of posts I publish to ensure I deliver sufficient value to both free and paid audiences. If you find my content valuable, I’d greatly appreciate your support by subscribing.
Introduction
We will focus on 16 labor market indicators that we can get for free from FRED API. If you want a more in-depth look at what FRED API can offer and how to use it, you can refer to my previous post below.

With so many indicators to analyse, it can feel overwhelming to process them all at once. To simplify our decision-making, we’ll use techniques like calculating z-scores for each indicator. This approach standardizes the data, making it more uniform and easier to interpret. You can see an example of the final output in the screenshot below. As always, I’ll be sharing the complete Python code, allowing you to customize it to suit your needs and apply it to your own work.
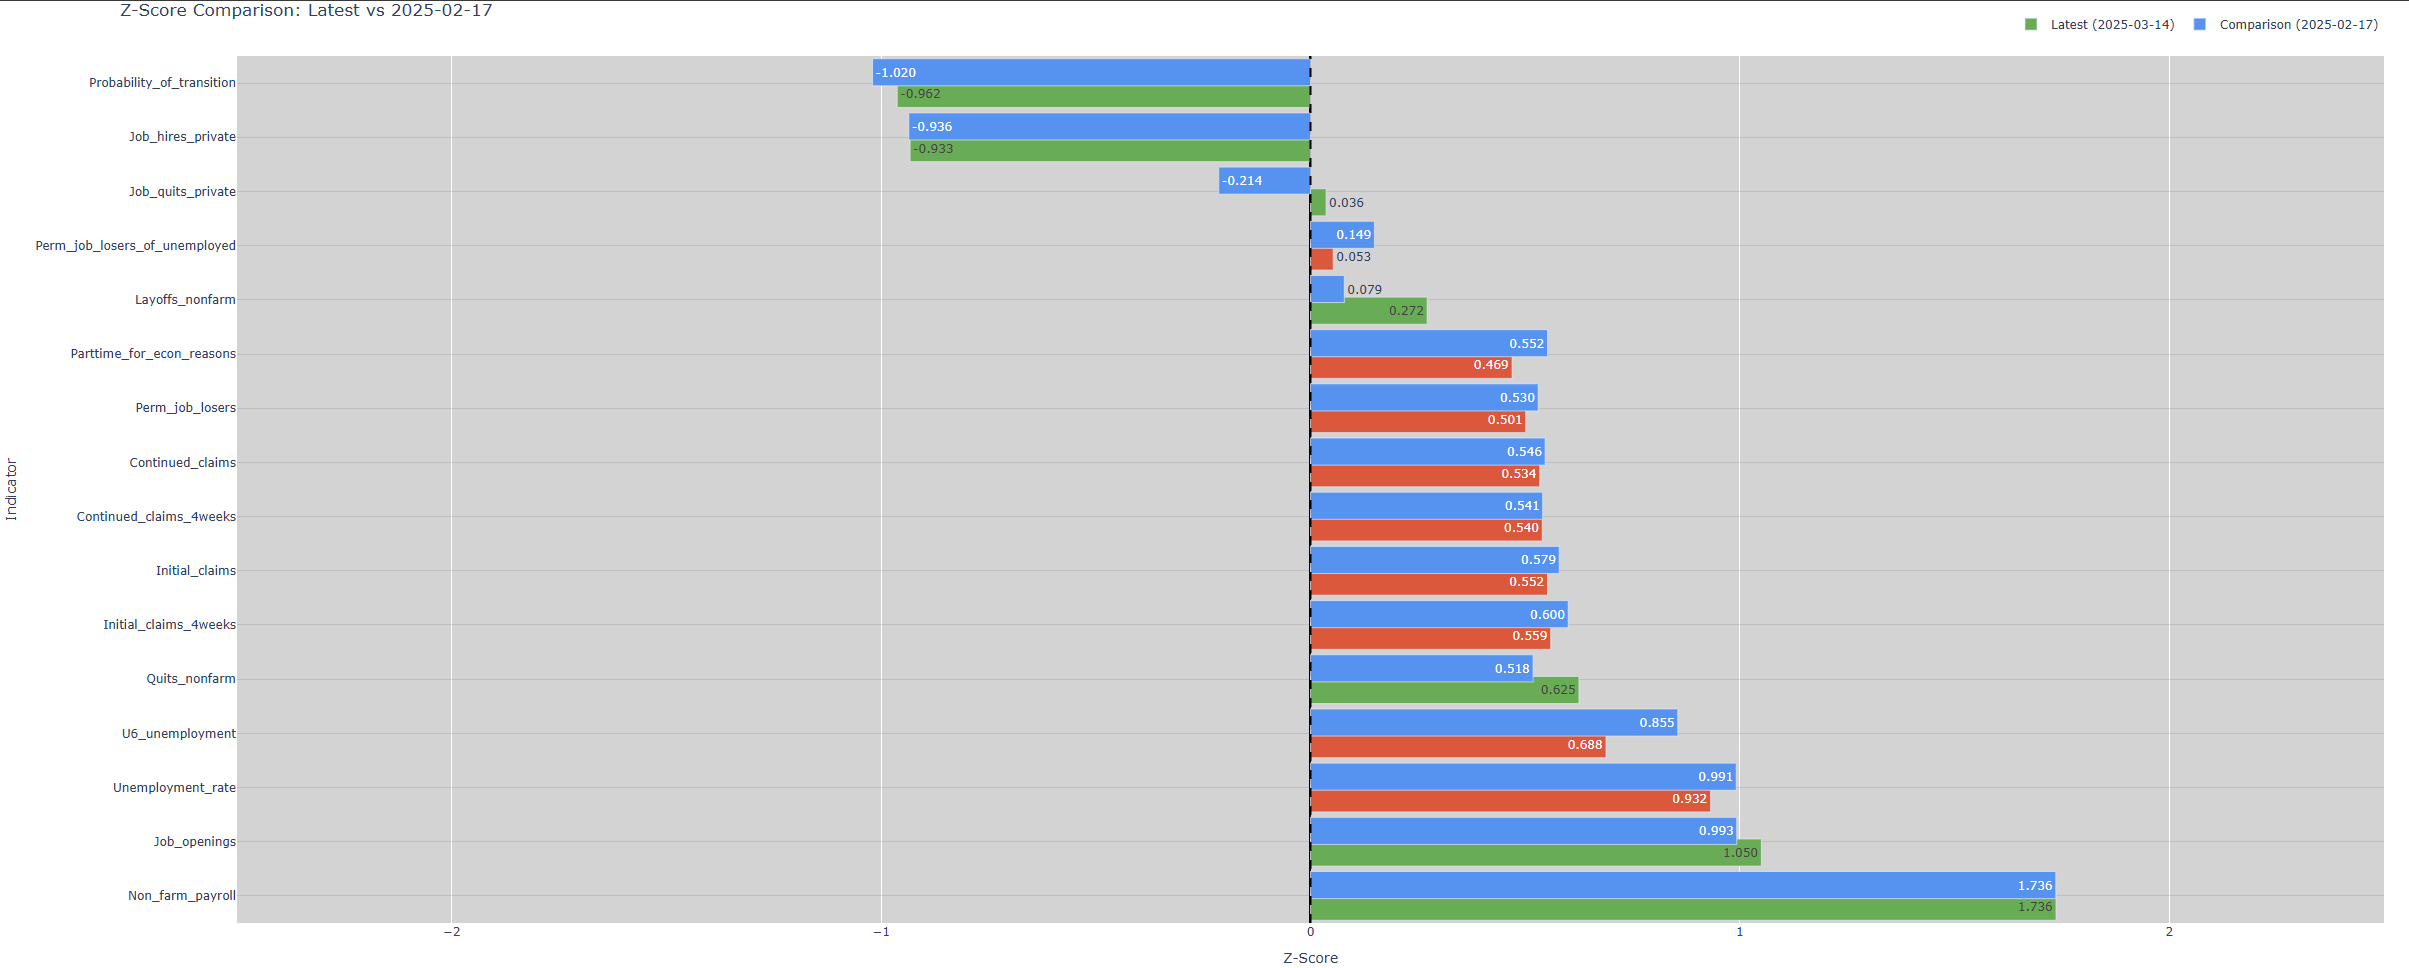
It the image above each indicator is represented by two horizontal bars that show the latest z-score and the indicator’s z-score on a specific date for comparison. When an indicator shows an improvement, the bar is painted green, when there is a deterioration, it turns red.
Now let’s explore what these indicators are, why we use z-scores, what the code is and how to analyse these results.
What are these indicators and what do they mean?
In this example, we’ll use 16 different indicators, each offering unique insights into the labor market. Some of these indicators are published weekly, while others are updated monthly. All of them, however, are accessible immediately after publication through the FRED API. To make the most of this data, it’s crucial to understand what these indicators represent and how they are calculated.
Initial claims, Continued claims and the 4-week averages
An initial claim refers to a claim filed by an unemployed individual after a separation from an employer. A person who has already filed an initial claim and who has experienced a week of unemployment then files a continued claim to claim benefits for that week of unemployment. We use both the raw numbers for these indicators and the 4-week averages of these numbers, also provided by FRED. If you want a more detailed breakdown of what these claims are, as well as another way to analyse these numbers, please refer to my previous post on the topic.
Job Openings, Hires, Quits and Layoffs
These indicators come from the Job Openings and Labor Turnover Survey (JOLTS) published by the U.S. Bureau of Labor Statistics.
Job openings includes all positions that are open on the last business day of the reference month. A job is open only if it meets all three of these conditions:
A specific position exists and there is work available for that position. The position can be full-time or part-time, and it can be permanent, short-term, or seasonal.
The job could start within 30 days, whether or not the employer can find a suitable candidate during that time.
The employer is actively recruiting workers from outside the establishment to fill the position. Active recruiting means that the establishment is taking steps to fill a position. It may include advertising in newspapers, on television, or on the radio; posting internet notices, posting “help wanted” signs, networking or making word-of-mouth announcements; accepting applications; interviewing candidates; contacting employment agencies; or soliciting employees at job fairs, state or local employment offices, or similar sources.
Higher openings signal that companies are expanding and are demanding a greater number of workers, which indicates a tighter labor market.
Hires include all additions to the payroll during the entire reference month, including new and rehired employees; full-time and part-time employees, permanent, short-term, and seasonal employees; employees who were recalled to a job at the location following a layoff (formal suspension from pay status) lasting more than 7 days; on-call or intermittent employees who returned to work after having been formally separated; workers who were hired and separated during the month, and transfers from other locations. A greater number of hires is a good indicator of a strong labor market.
Quits include employees who left voluntarily with the exception of retirements or transfers to other locations. If a worker quits voluntarily, it signifies that he or she may believe that getting another, better job is possible and isn’t worried about a prolonged period of unemployment. Higher quits correspond to a tighter labor market and growing wages.
Layoffs and discharges include involuntary separations initiated by the employer including layoffs with no intent to rehire; layoffs (formal suspension from pay status) lasting or expected to last more than 7 days; discharges resulting from mergers, downsizing, or closings; firings or other discharges for cause; terminations of permanent or short-term employees; and terminations of seasonal employees (whether or not they are expected to return the next season). Greater layoffs may signify employer distress and are generally observed when economy takes a downturn.
Permanent job losers and permanent job losers as % of unemployed
Permanent job losers refer to unemployed persons whose employment ended involuntarily and who began looking for work. This is in contrast to people on temporary layoff who have been given a date to return to work or who expect to return within 6 months. We pull both the raw number for this indicator and a separate indicator that shows this indicator as percentage of total unemployed. Obviously, an increase in either indicators signifies a worsening labor market.
Nonfarm payrolls
Commonly known as Total Nonfarm Payroll, is a measure of the number of U.S. workers in the economy that excludes proprietors, private household employees, unpaid volunteers, farm employees, and the unincorporated self-employed. This measure accounts for approximately 80 percent of the workers who contribute to Gross Domestic Product (GDP). Increase in the number of jobs in an economy corresponds to a tighter labor market. Along with unemployment claims, this is probably the most closely-watched labor indicator.
U-3 Unemployment rate
The unemployment rate represents the number of unemployed as a percentage of the labor force. Labor force data are restricted to people 16 years of age and older, who currently reside in 1 of the 50 states or the District of Columbia, who do not reside in institutions (e.g., penal and mental facilities, homes for the aged), and who are not on active duty in the Armed Forces. This rate is also defined as the U-3 measure of labor underutilization and is the “official” rate of unemployment. An increase in unemployment rate signals a worsening labor market.
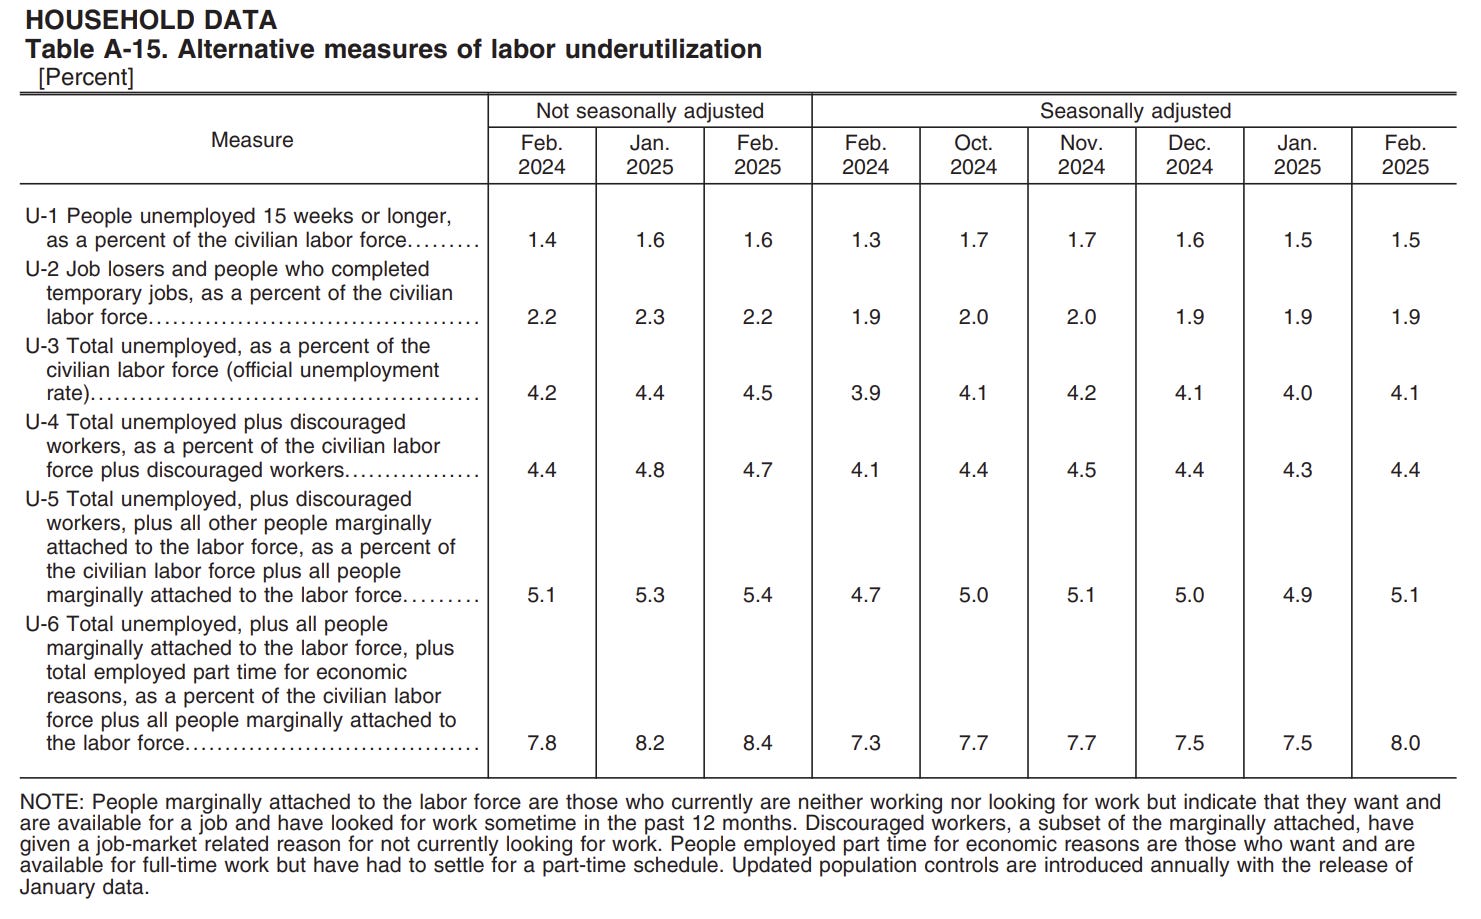
U-6 Unemployment rate
This is an “expanded” measure of unemployment that includes total unemployed, plus all people marginally attached to the labor force, plus total employed part time for economic reasons, as a percent of the civilian labor force plus all people marginally attached to the labor force. Naturally, this measure will always be higher that the U-3 measure and can provide better insight into the labor market. Below is a screenshot from The Employment Situation that illustrates all the different unemployment rates.
Probability of transition
Employer-to-Employer (E2E) Transition Probability tracks the rate at which U.S. workers transition from one employer to another in a given month. Expressed as the share (percentage) of movers among all employed workers in the previous month, E2E Transition Probability provides a timely gauge of the pace of worker reallocation in the U.S. labor market. Generally, workers have an easier time moving between employers in a tighter labor market, so a decrease in this indicator may signal a deterioration.
Part-Time for Economic Reasons, Could Only Find Part-Time Work
These individuals would have preferred full-time employment but were working part time because their hours had been reduced or they were unable to find full-time jobs and could only find part-time work. A higher number of these individuals signifies a worsening labor market.
Pulling the indicators from FRED
Now let’s move on to the code. First, we will pull all the indicators we mentioned from FRED API in the code below. If you want an introduction to FRED API code, refer to my previous post. That post covers why we use the first releases of indicators, what revisions are and how they appear in the FRED API, as well as the advantages and disadvantages of using seasonally adjusted data. For this analysis, we’ll use seasonally adjusted data since our goal is to compare indicators on a month-to-month basis.
pip install fredapi
import pandas as pd
import numpy as np
from fredapi import Fred
fred = Fred(api_key='your API key goes here')
Job_hires_private = fred.get_series_all_releases('JTS1000HIR')
Job_quits_private = fred.get_series_all_releases('JTS1000QUR')
Perm_job_losers = fred.get_series_all_releases('LNS13026638')
Perm_job_losers_of_unemployed = fred.get_series_all_releases('LNS13026511')
Initial_claims = fred.get_series_all_releases('ICSA')
Initial_claims_4weeks = fred.get_series_all_releases('IC4WSA')
Non_farm_payroll = fred.get_series_all_releases('PAYEMS')
Continued_claims = fred.get_series_all_releases('CCSA')
Continued_claims_4weeks = fred.get_series_all_releases('CC4WSA')
Unemployment_rate = fred.get_series_all_releases('UNRATE')
Job_openings = fred.get_series_all_releases('JTSJOL')
Quits_nonfarm = fred.get_series_all_releases('JTSQUL')
Layoffs_nonfarm =  fred.get_series_all_releases('JTSLDL')
Probability_of_transition = fred.get_series_all_releases('FMPSA3MA')
Parttime_for_econ_reasons = fred.get_series_all_releases('LNS12032196')
U6_unemployment = fred.get_series_all_releases('U6RATE')
Now we need to only keep the first releases for all data series and remove revision numbers. We do this to avoid introducing any look-ahead bias in our analysis.
# Store FRED series in a list
fred_series_list = [Job_hires_private, Job_quits_private, Perm_job_losers, Perm_job_losers_of_unemployed, Initial_claims, Initial_claims_4weeks, Non_farm_payroll, Continued_claims, Continued_claims_4weeks, Unemployment_rate, Job_openings, Quits_nonfarm, Layoffs_nonfarm, Probability_of_transition, Parttime_for_econ_reasons, U6_unemployment]

# Loop through the list and get only first release of indicator
for i in range(len(fred_series_list)):
    # Create a copy of the dataframe
    df_copy = fred_series_list[i].copy()

    df_copy = df_copy.drop_duplicates(subset=['date'], keep='first')

    #Replace original with copy where only one first publication is kept
    fred_series_list[i] = df_copy

# Access the new series using their original names
Job_hires_private = fred_series_list[0]
Job_quits_private = fred_series_list[1]
Perm_job_losers = fred_series_list[2]
Perm_job_losers_of_unemployed = fred_series_list[3]
Initial_claims = fred_series_list[4]
Initial_claims_4weeks = fred_series_list[5]
Non_farm_payroll = fred_series_list[6]
Continued_claims = fred_series_list[7]
Continued_claims_4weeks = fred_series_list[8]
Unemployment_rate = fred_series_list[9]
Job_openings = fred_series_list[10]
Quits_nonfarm = fred_series_list[11]
Layoffs_nonfarm =  fred_series_list[12]
Probability_of_transition = fred_series_list[13]
Parttime_for_econ_reasons = fred_series_list[14]
U6_unemployment = fred_series_list[15]
Calculating z-scores
Next, we’ll calculate z-scores for each series. This step will standardize the data, making it easier to interpret and compare each indicator to its historical values. The indicators we’re working with are quite diverse: some are expressed as rates or percentages, while others represent the number of people in thousands. Additionally, the direction of change varies by indicator—an increase in one may signal a positive trend (e.g., job hires), while an increase in another could indicate a negative trend (e.g., unemployment rate).
A z-score, also known as a standard score, quantifies how many standard deviations a data point is from the mean of its dataset, providing a measure of relative position. It is calculated by subtracting the mean (μ) from the individual data value (X) and dividing the result by the standard deviation (σ) of the dataset. This standardization transforms data into a common scale, enabling comparisons across different datasets or variables with varying units or ranges. By expressing values in terms of their distance from the mean, z-scores simplify understanding variability and benchmarking performance in diverse contexts.
In the code below, we calculate z-scores for each indicator using an expanding mean and standard deviation. This method incorporates all data points from the start of the dataset up to each successive point in time. By doing so, the expanding metrics reflect the entire historical trend up to that point, emphasizing long-term patterns and gradual shifts.
Using the mean and standard deviation for the entire dataset isn’t an option, as it would introduce look-ahead bias. In such a case, calculations for a specific date would be influenced by data that became available after that date, skewing the results. An alternative approach would be to use a rolling window to calculate the mean and standard deviation. However, this raises questions about the window size: Should it start before or after the pandemic? Rolling metrics focus on localized trends within the chosen window, smoothing short-term fluctuations and highlighting recent changes.
Both approaches have their advantages and disadvantages, which could warrant further analysis. For this example, however, the expanding approach works well.
My goal is to provide you with the tools that will give you an edge in the markets. Follow the link below to get 10% off for the next 12 months.
Become a paid subscriber to receive:
Trading indicators and strategies. Full, ready-to-use code for your investing — no black boxes or holy grails, just full transparency and ownership of your advantage.
Weekly newsletter covering current market conditions. Analysis on economic trends, key data releases, and actionable insights to stay ahead of market shifts.
